Note: This website was automatically translated, so some terms or nuances may not be completely accurate.
Explanation of "2024 Internet Advertising Media Expenditures." Video advertising growth is accelerating further. Social advertising expenditures exceed 1 trillion yen.
CARTA COMMUNICATIONS (CCI), Dentsu Inc., Dentsu Digital Inc., and SEPTENI CO.,LTD jointly released the " 2024 Detailed Analysis of Japan's Advertising Expenditures: Internet Advertising Media Costs " (hereinafter referred to as this survey). Takahiro Konno of CCI explains the key points of this survey.

*News Release : "2024 Japan Advertising Expenditure: Detailed Analysis of Internet Advertising Media Costs"
<Table of Contents>
▼Internet Advertising Expenditures Hit New Record High in 2024
▼ [Ad Type] Video Advertising Share Exceeds Display Advertising for the First Time
▼[ Transaction Method] Performance-Based Advertising Accounts for Nearly 90%. What Happened to Third-Party Cookie Regulations?
▼[Ad Type × Transaction Method] Video ad growth shows no signs of stopping: Breakdown of internet advertising spending
▼Topic ① Vertical video adoption significantly contributes to out-stream ad growth
▼Topic ② Social advertising spending surpasses ¥1 trillion for the first time
▼Topic 3: The spread and penetration of "Connected TV" supporting the expansion of the TV media digital market
▼ "Product-based e-commerce platform advertising spend" enters a slightly more stable growth trajectory
▼What will internet advertising spend look like in 2025? What impact will "ad-supported plans" from paid subscription video services have?
Related Articles:
"2024 Japan Advertising Expenditures" Analysis: Record Highs for Third Consecutive Year. Mass Media Advertising Spending Sees First Growth in Three Years
What's the True Intent Behind the "Declaration to Quit Mass Media"? The Current State of Regional Media
Internet Advertising Spending Hits Record High Again in 2024
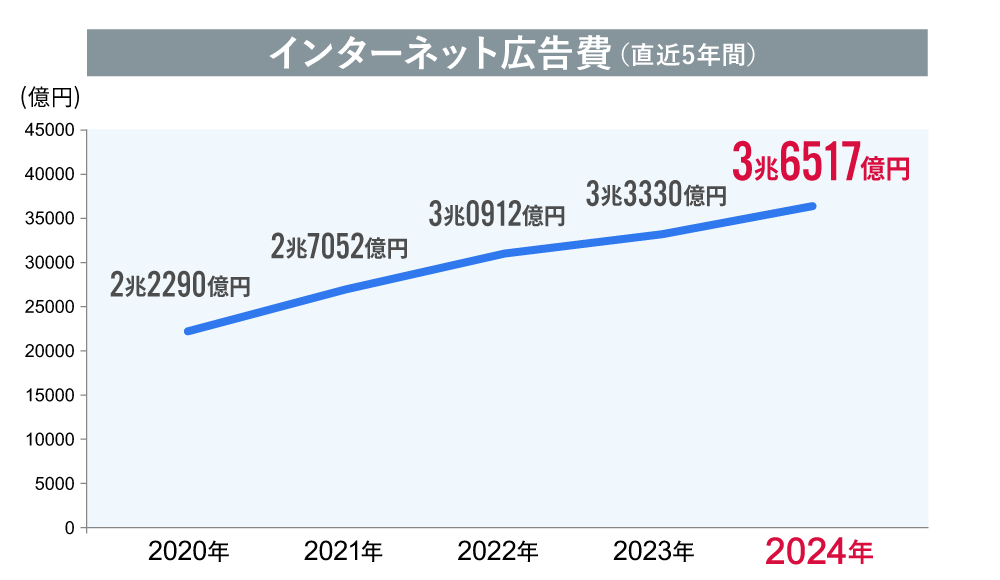
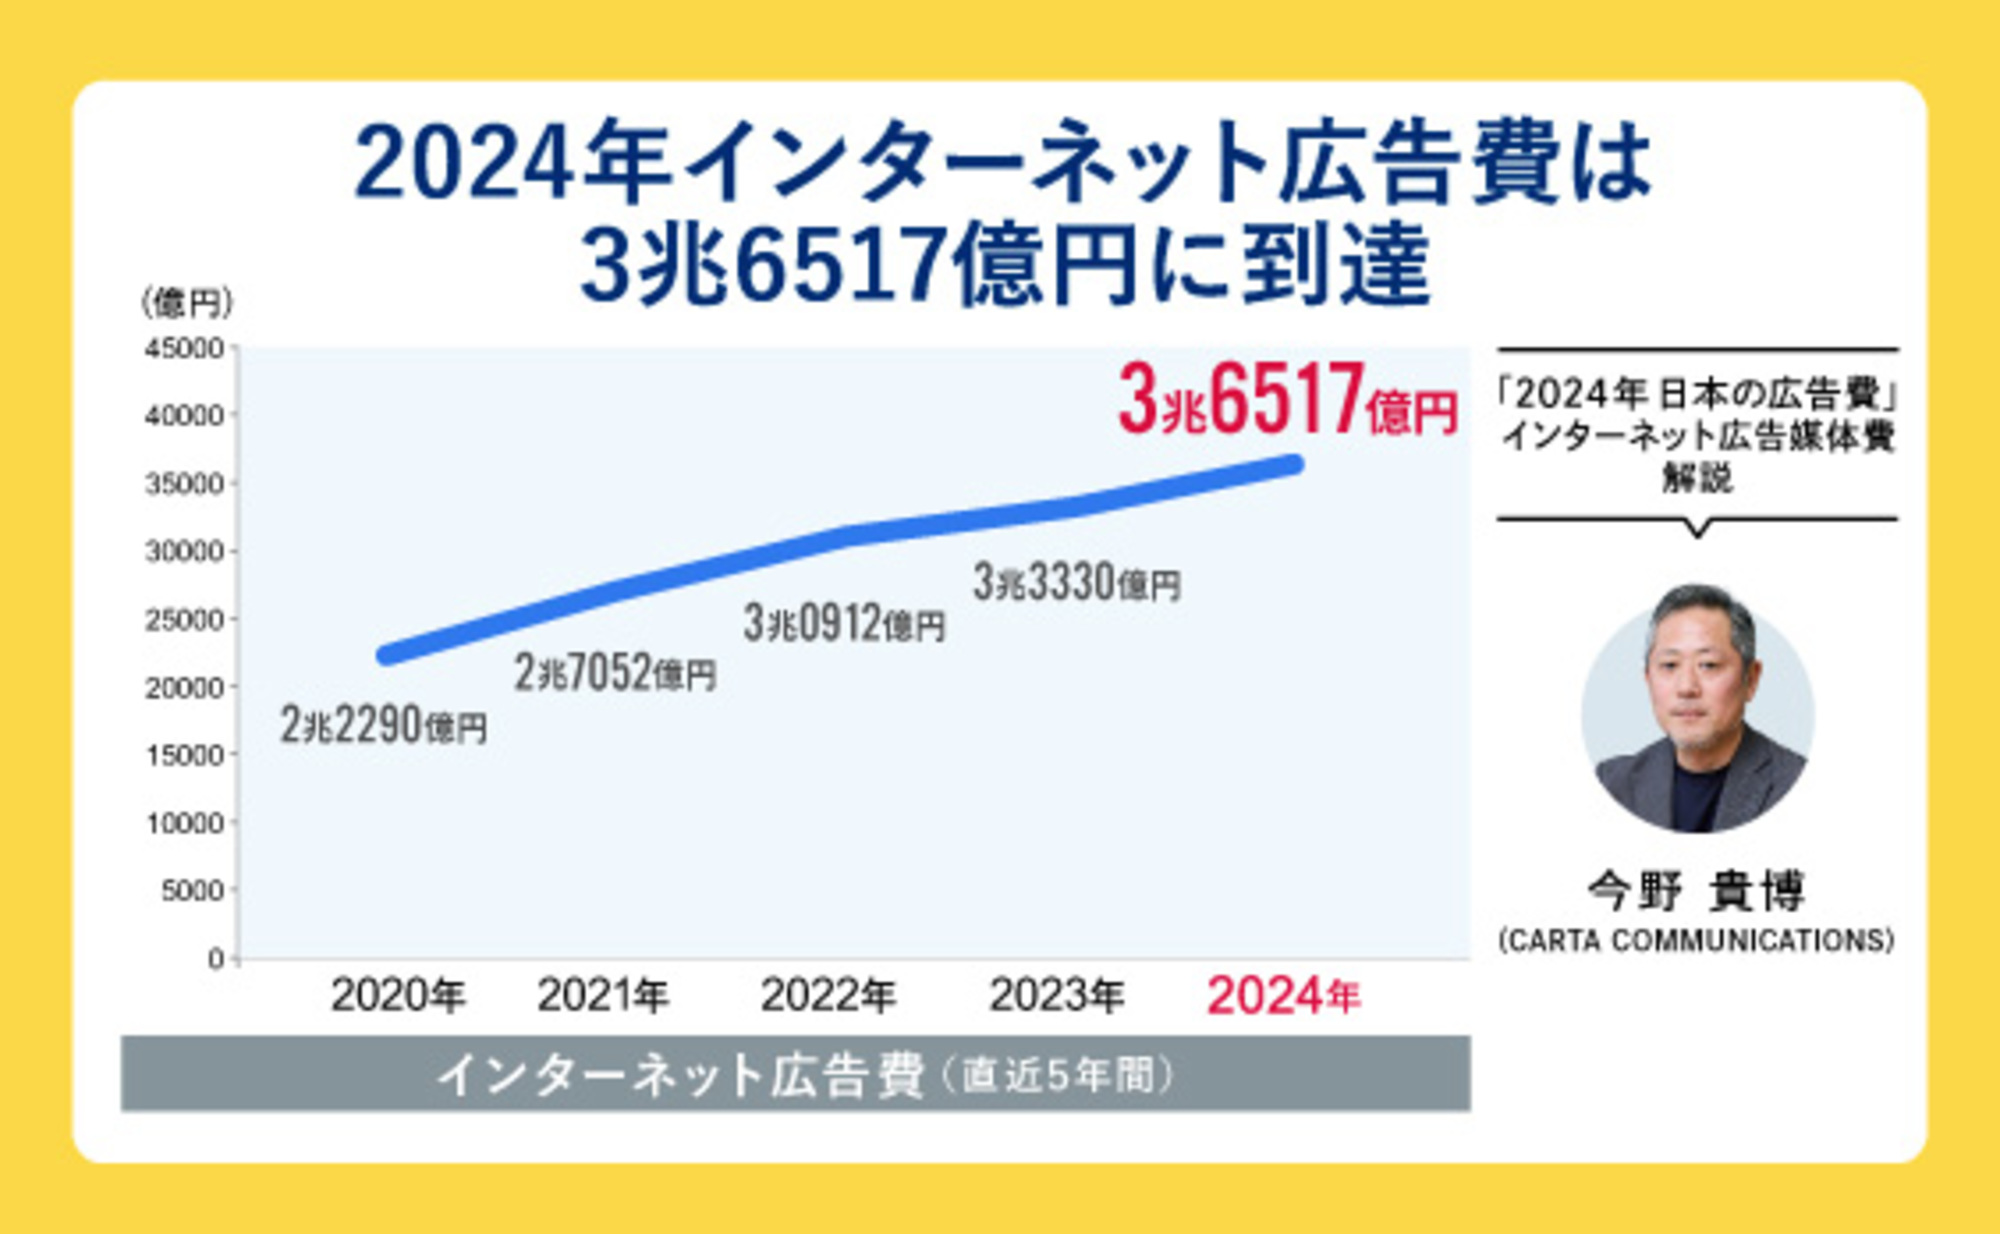
Japan's total advertising expenditure in 2024 reached ¥7.673 trillion, a 104.9% increase year-on-year, setting a new record high for the third consecutive year since 2022.
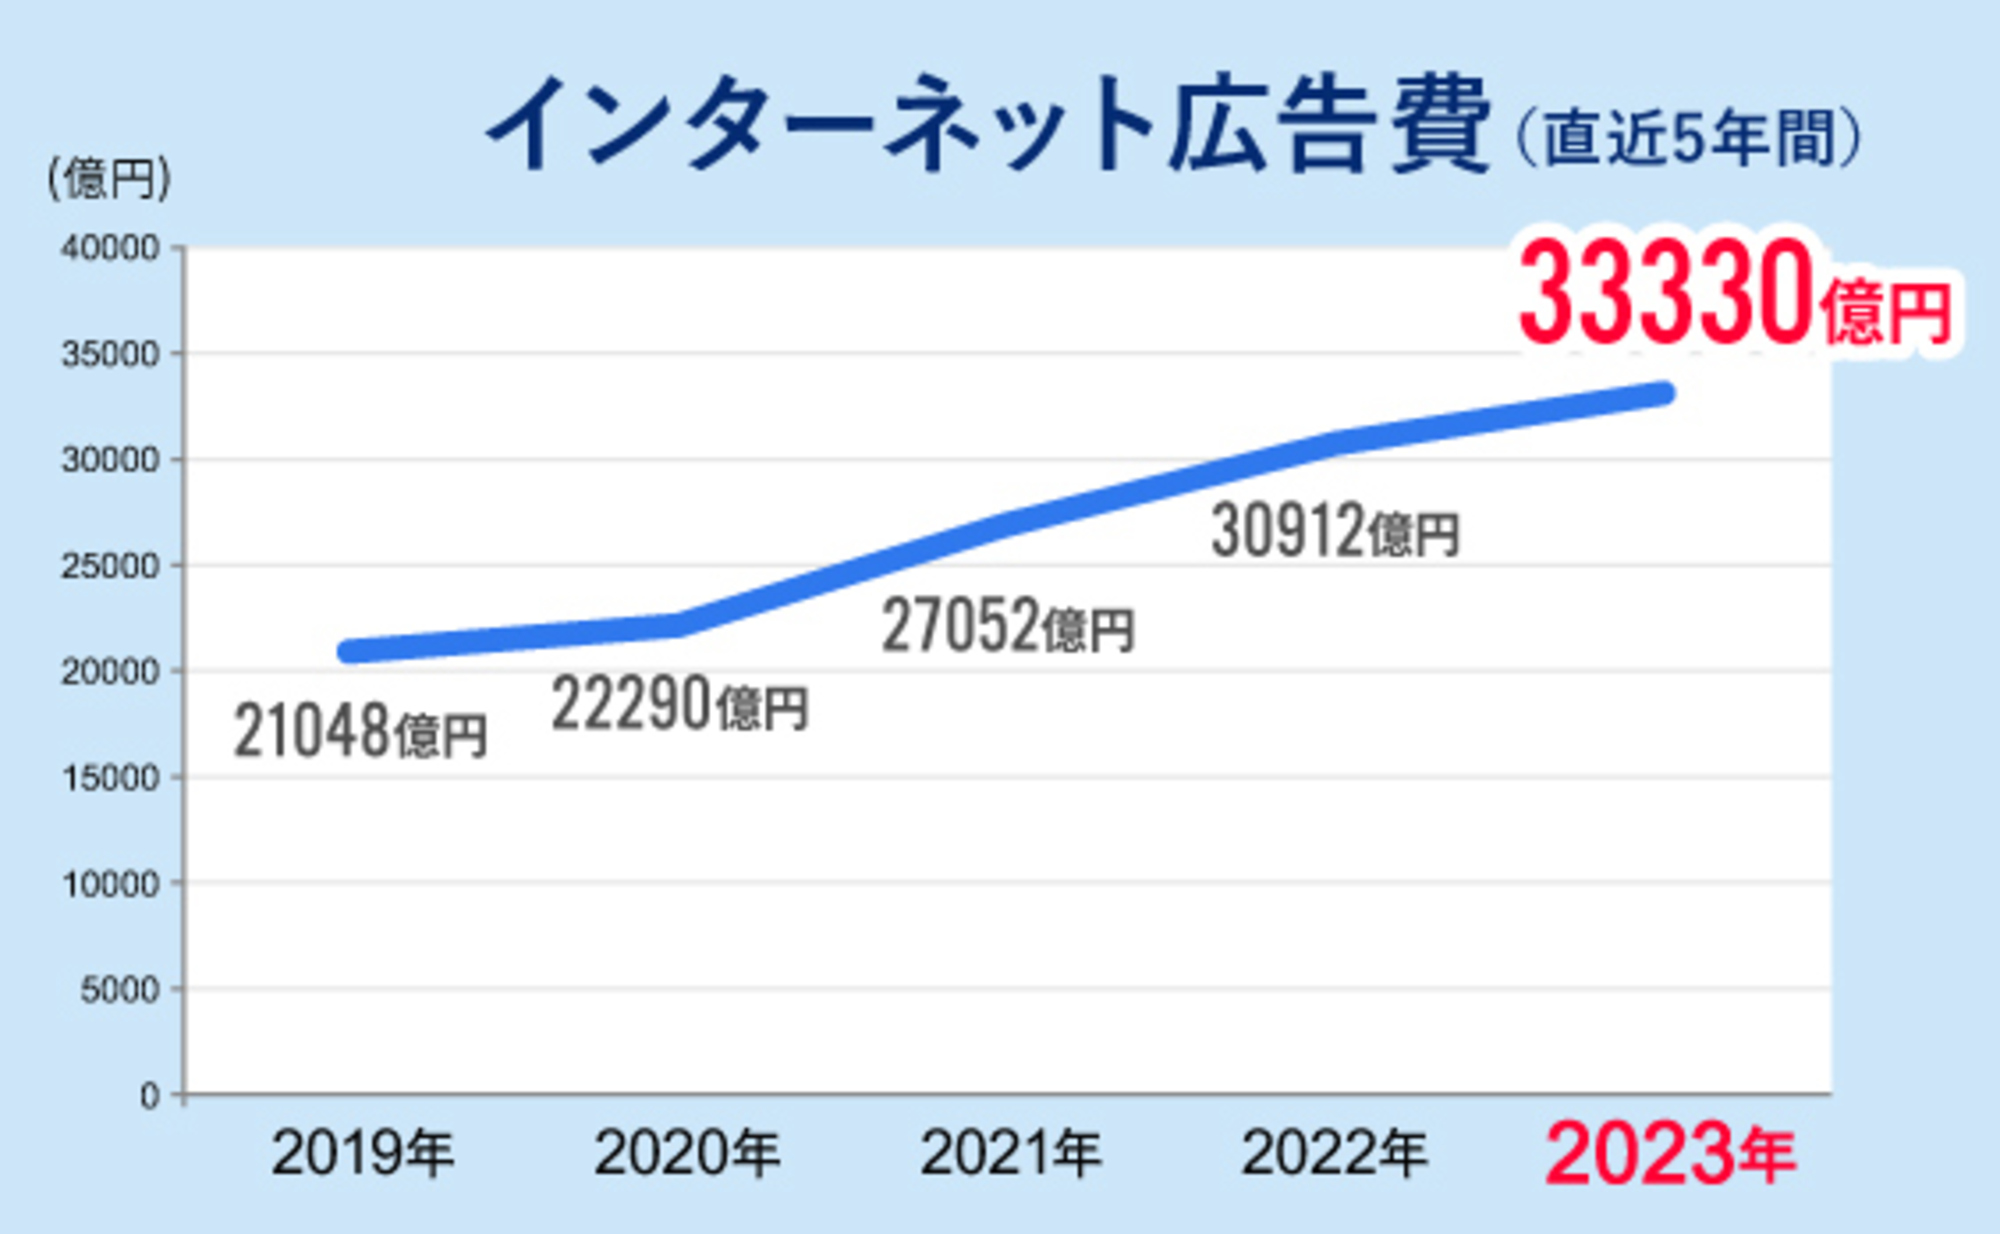
Internet advertising spending continued its steady growth from the previous year, reaching ¥3.6517 trillion (109.6% year-on-year), also setting a new record high. It accounted for 47.6% of Japan's total advertising spending, approaching nearly half of the total, and continues to drive market growth.
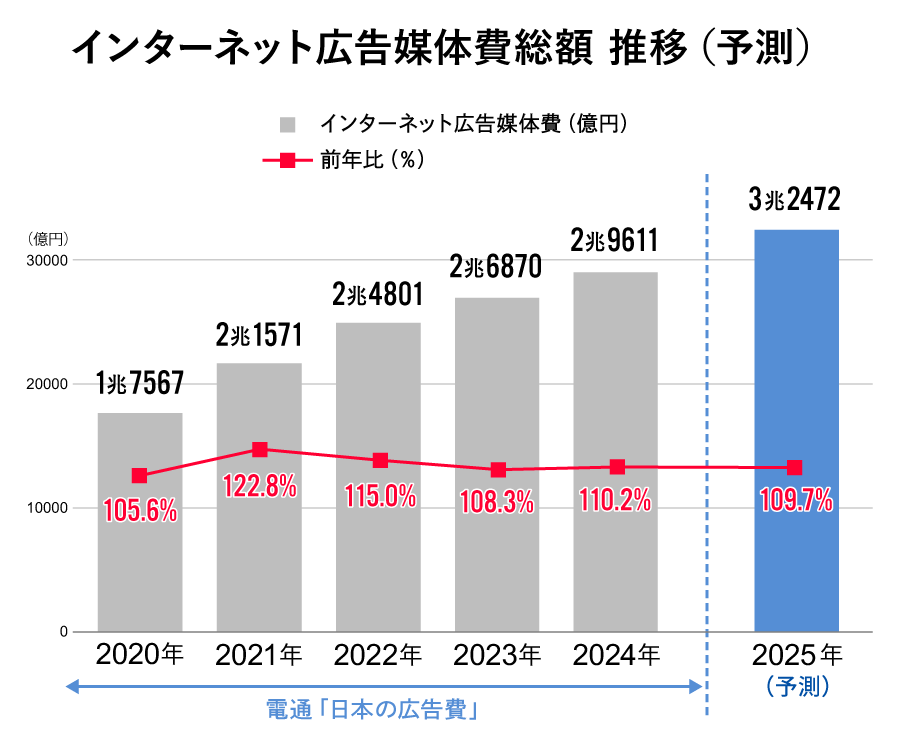
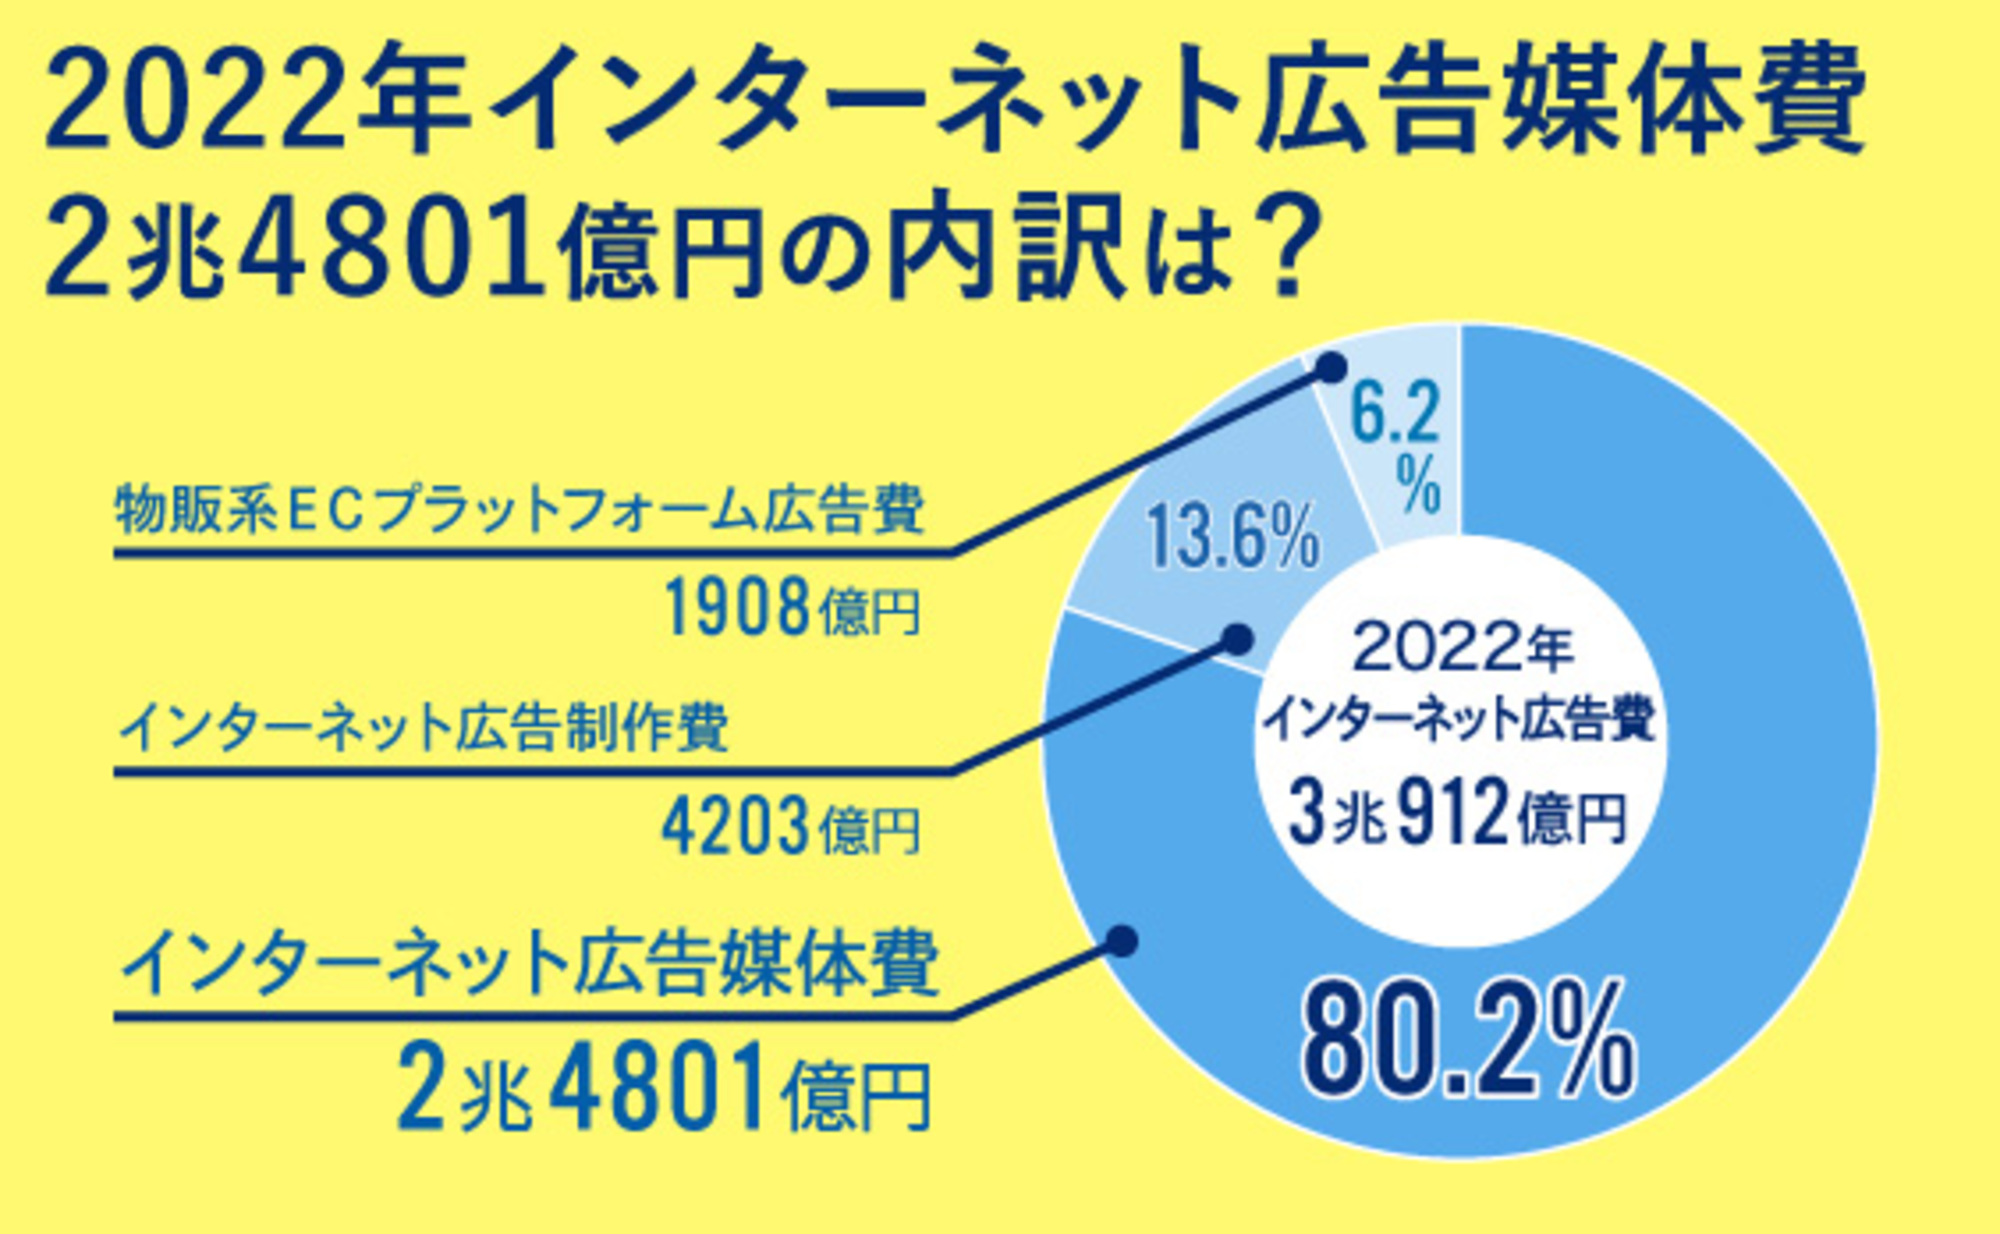
This article explains the breakdown of "Internet Advertising Media Costs" (¥2.9611 trillion, 110.2% year-on-year), which excludes "Internet Advertising Production Costs" and "E-commerce Platform Advertising Costs" from total Internet advertising spending. 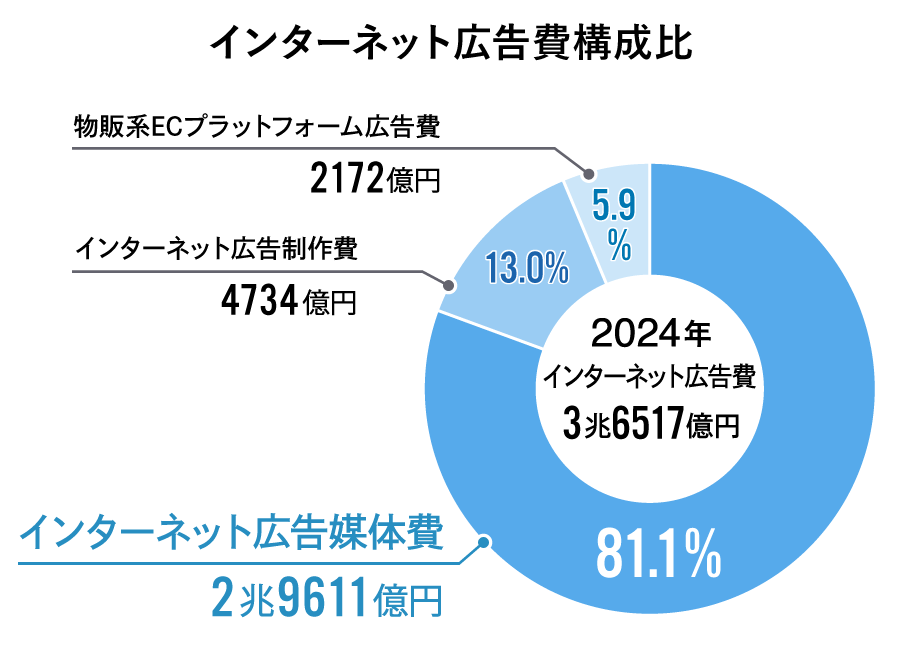
[Ad Type] Video ad share surpasses display ads for the first time
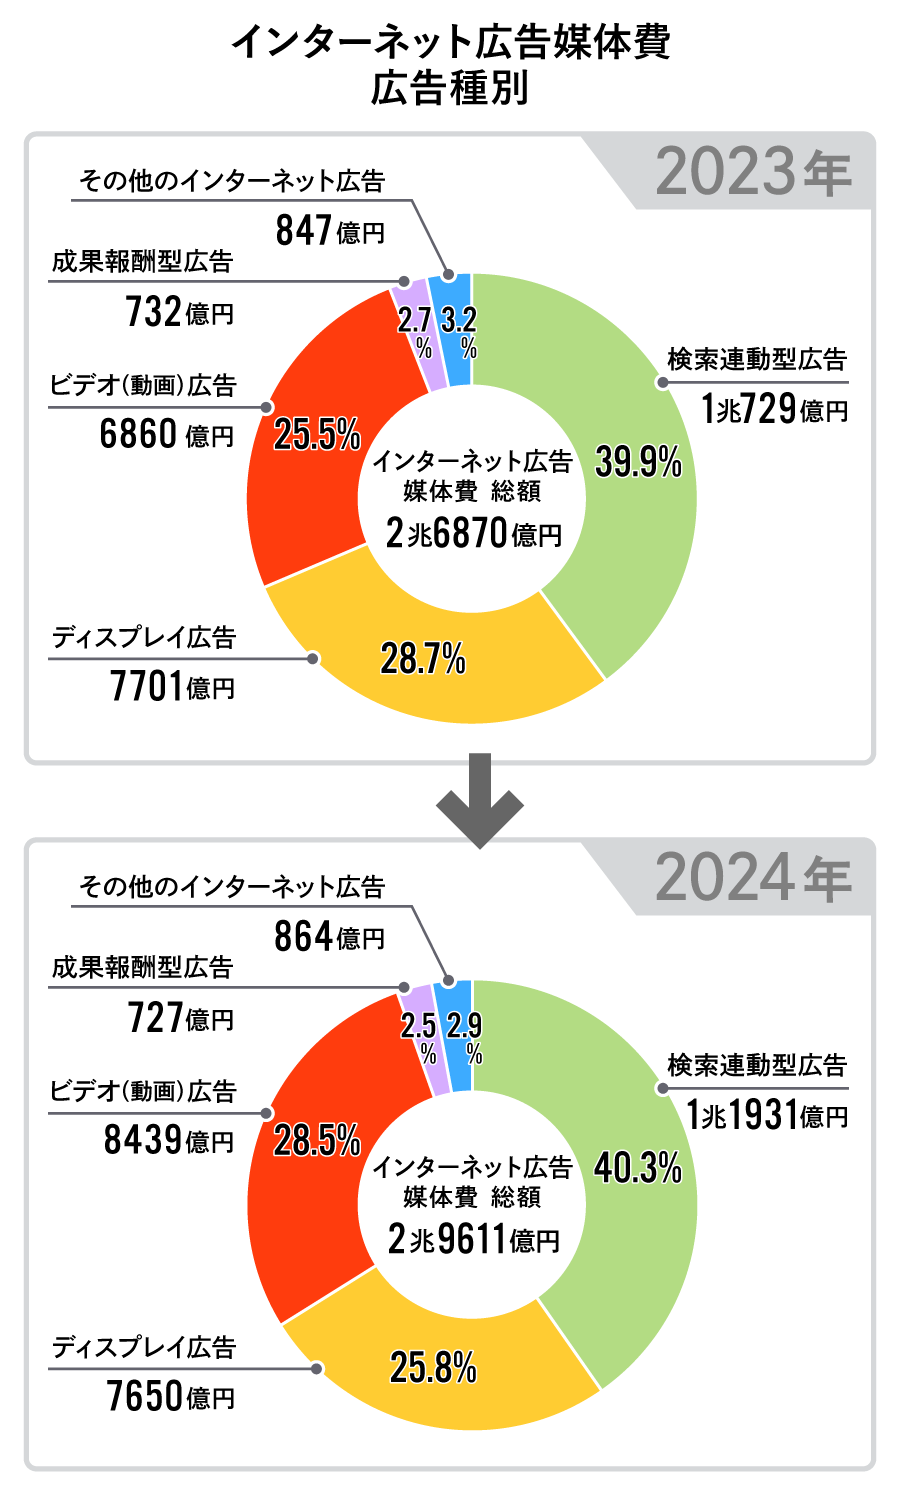
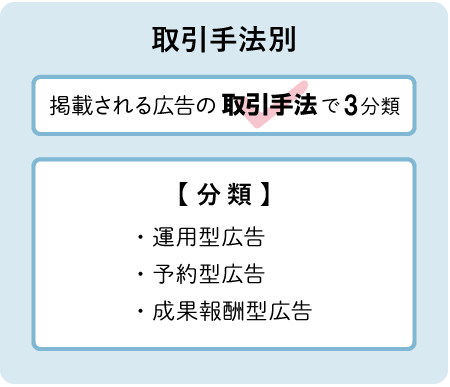
First, we examine the breakdown of internet advertising media costs by "advertising type." Advertising types are classified into the following five categories.

Among these, "Video (Motion Picture) Ads" deserve particular attention. This category includes advertisements in video file formats (visuals and audio).
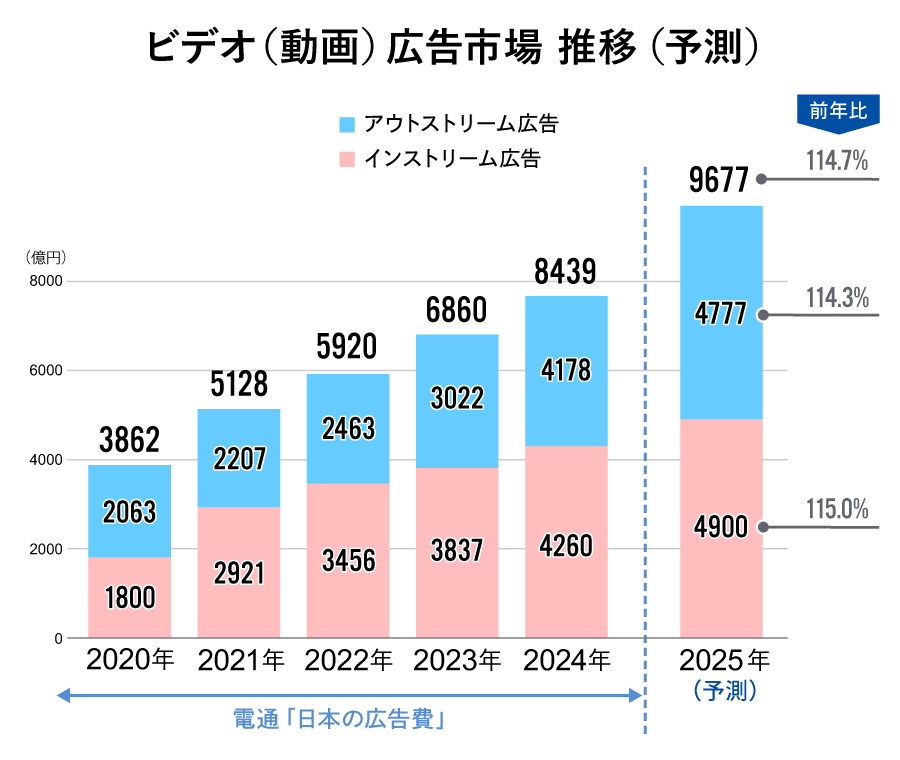
Video advertising recorded the highest growth rate among ad types, reaching ¥843.9 billion, a 123.0% increase year-on-year. While last year's projections anticipated growth to ¥769.7 billion, the actual growth far exceeded this, showing a sharp increase. Its share within ad types reached 28.5%, surpassing display advertising (25.8% share) for the first time since estimates began.
As we will discuss in detail later, "out-stream ads"—video ads displayed "outside of video content," such as in display ad slots or in-feed ad slots—have grown significantly. While "in-stream ads" placed before, after, or during video content also grew, out-stream ads showed even stronger growth, nearly matching their share. This surge in out-stream ads is considered one of the key factors driving the growth of video advertising.
Categories other than video advertising also grew. Continuing from the previous year, "search-linked advertising" showed the highest share among ad types (40.3%).
Search-linked advertising refers to ads displayed on search engine results pages based on specific keywords entered into search engines, primarily search sites. This includes what are commonly known as listing ads. It recorded double-digit growth, reaching ¥1,193.1 billion, a 111.2% increase year-on-year. This represents a further increase from last year, when it exceeded ¥1 trillion for the first time since estimates began.
On the other hand, "Display Advertising" saw a decrease in both advertising expenditure and share. This is likely due to traditional static image and text-based ads being replaced by the aforementioned out-stream ads. The growth of out-stream ads is also related to the rise of vertical videos, particularly on SNS platforms. This will be explained in detail later.
[By Transaction Method] Performance-based advertising accounts for nearly 90%. What happened with third-party cookie regulations?
Next, let's examine the breakdown of internet advertising media costs by transaction method.
"Programmatic advertising" refers to ads traded via an "auction-based system" through platforms such as search-linked ads, video-sharing sites, and social media, as well as DSPs (Demand-Side Platforms) and ad networks.
On the other hand, advertisements traded at a "non-bid (fixed price)" rate as specific non-bid ads or tie-up advertisements are called "reservation-based advertising."
Performance-based advertising refers to ads where compensation is paid to the media outlet or the viewing user based on the actions taken by the user who viewed the ad (such as clicks or purchases).
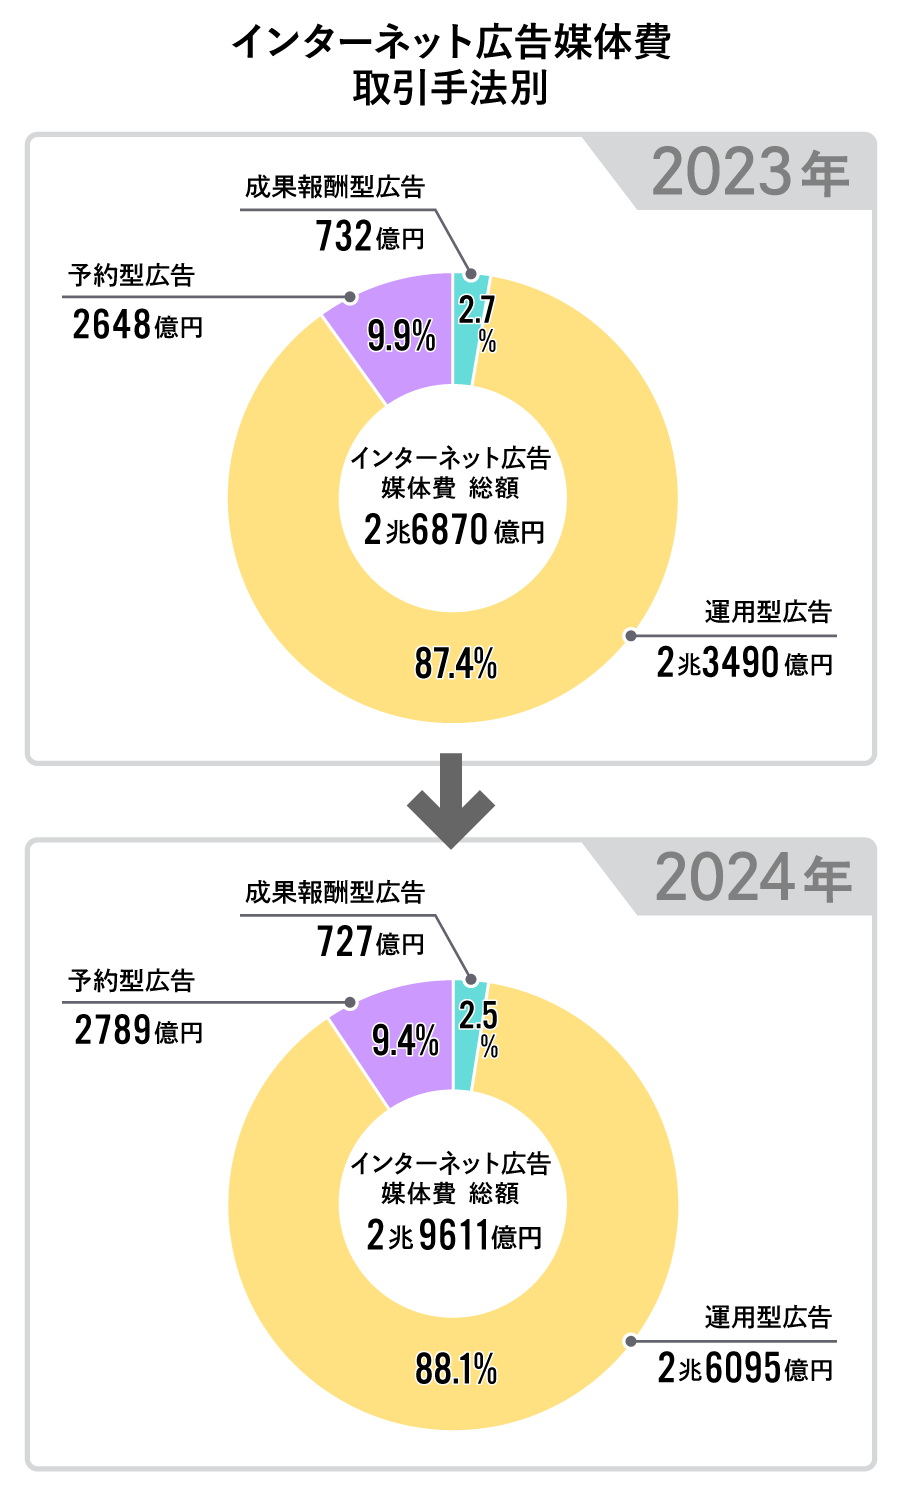
In terms of composition by transaction method, performance-based advertising dominates. Continuing its steady growth, performance-based advertising reached ¥2.6095 trillion, a 111.1% increase year-on-year, setting a new record high in 2024. Its share also surpassed the previous year, reaching 88.1%, approaching nearly 90%.
Reservation-based advertising increased to ¥278.9 billion, a 5.4% year-on-year increase. This growth is likely driven by the significant expansion of video advertising.
Performance-based advertising showed a slight decrease, reaching ¥72.7 billion, a 99.3% year-on-year figure.
Now, programmatic advertising continues to drive the growth of internet advertising spending, and the technology supporting it is third-party cookies. Last year, concerns were raised about the impact of third-party cookie regulations. However, in July 2024, Google announced a de facto shift in its plans. To date, the programmatic advertising market continues to grow steadily, unchanged from previous trends.
Nevertheless, the trend toward privacy protection will undoubtedly continue. Various alternatives (cookie-less solutions), including those from Google itself, are being explored for different use cases. We must continue to monitor developments closely.
[Ad Type × Transaction Method] Video Advertising Growth Shows No Signs of Stopping: Breakdown of Internet Advertising Expenditures
Next, let's examine the figures combining advertising type and transaction method.Next, we examine figures combining ad type and transaction method.
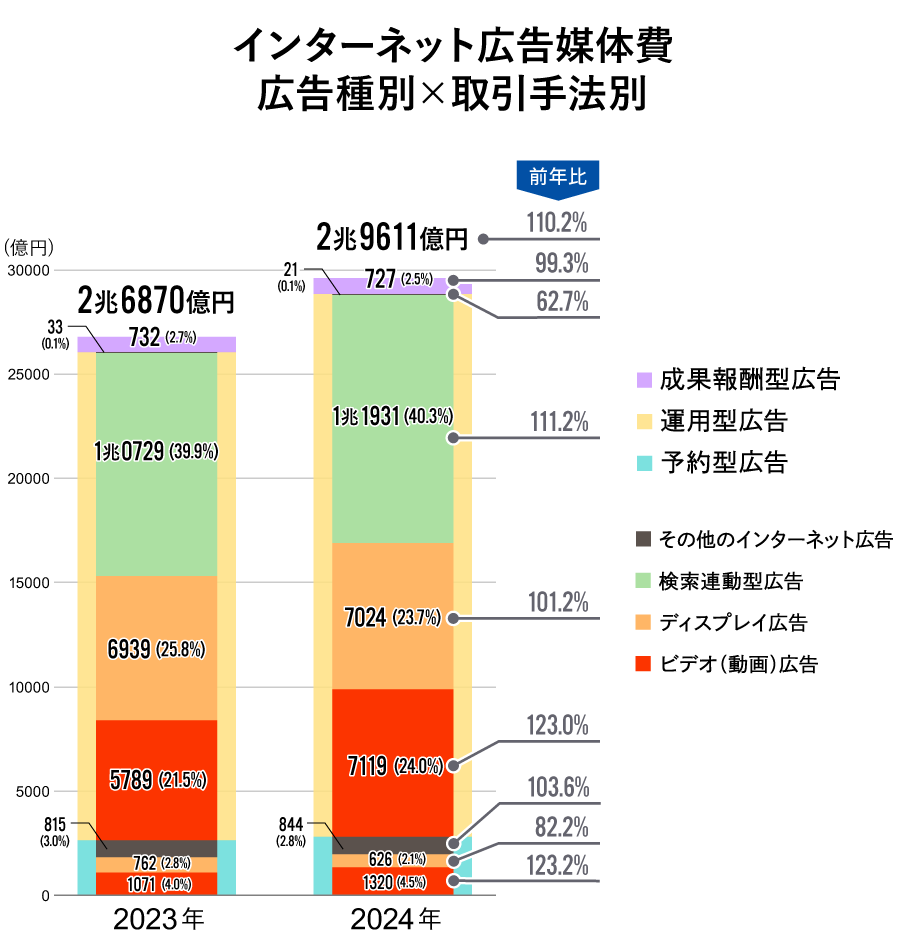
In terms of composition by advertising type × transaction method, "search-linked advertising" holds the highest share of total internet advertising media spending at 40.3%.
This was followed by "managed video advertising" at 24.0%, which surpassed "managed display advertising" for the first time since the start of the estimation period.
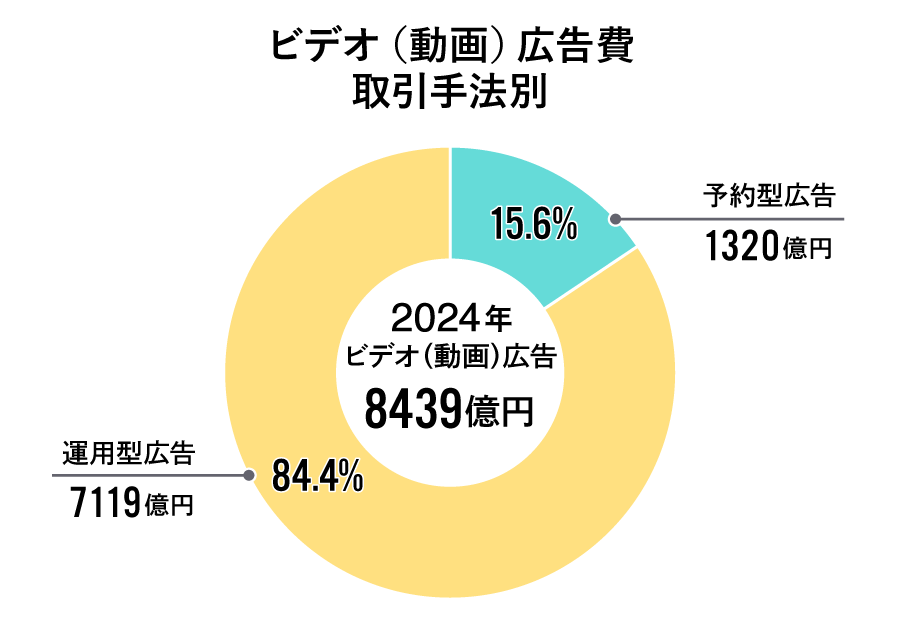
Regarding video advertising, both programmatic (123.0% year-on-year growth to ¥711.9 billion) and reserved (123.2% year-on-year growth to ¥132.0 billion) formats showed significant expansion. The increase in reserved video advertising is thought to be related to the growth of free on-demand video services and internet TV services offered by entities such as television broadcasters.
Topic ①: The proliferation of vertical videos has significantly contributed to the growth of out-stream advertising.
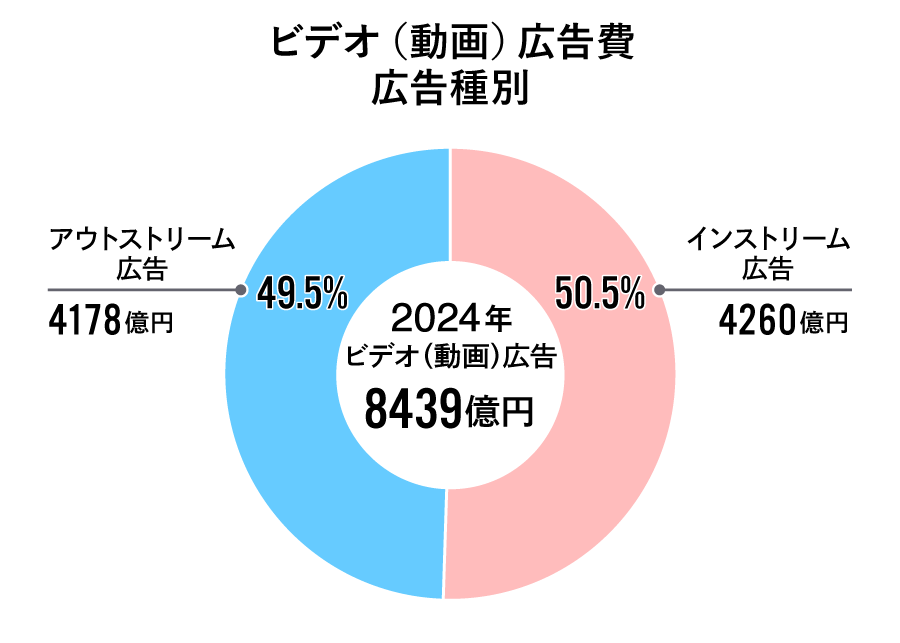
As mentioned earlier, video advertising expenditure reached ¥843.9 billion, a 123.0% increase year-on-year, recording the highest growth rate among all advertising categories.
Breaking this down, in-stream advertising accounted for ¥426.0 billion (50.5% share), while out-stream advertising accounted for ¥417.8 billion (49.5% share), remaining nearly equal.
To clarify, in-stream ads are video advertisements that play before, during, or after video content. They are commonly seen on video-sharing sites, free on-demand streaming services, and internet TV services.
Outstream ads, on the other hand, refer to video ads displayed in video file format within display ad slots or social media feed ad slots. These are video ads separate from the "video content" itself. Some video-sharing sites and social media platforms allow both in-stream and out-stream ads to be placed.
The situation where the proportions of in-stream and out-stream ads are evenly balanced symbolizes the recent changes in the video advertising market.
While out-stream ad growth was notable last year, the trend of ads traditionally classified as display ads being "replaced" by video formats is accelerating. Furthermore, the rapid rise of vertical video formats on social media and user-generated video sharing sites is also driving the growth of out-stream advertising.
Meanwhile, instream ads also maintained a growth rate similar to last year, partly due to the rapid rise of "digital TV media" mentioned earlier.
Given the enormous scale of the SNS market, there is considerable potential for out-stream advertising to grow further alongside the adoption of vertical video. However, in-stream advertising also holds growth potential. By 2025, paid subscription-based video streaming services are expected to accelerate the adoption of advertising models to fund further content investment, which will impact in-stream advertising spending.
Topic 2: Social Advertising Spending Exceeds ¥1 Trillion for the First Time
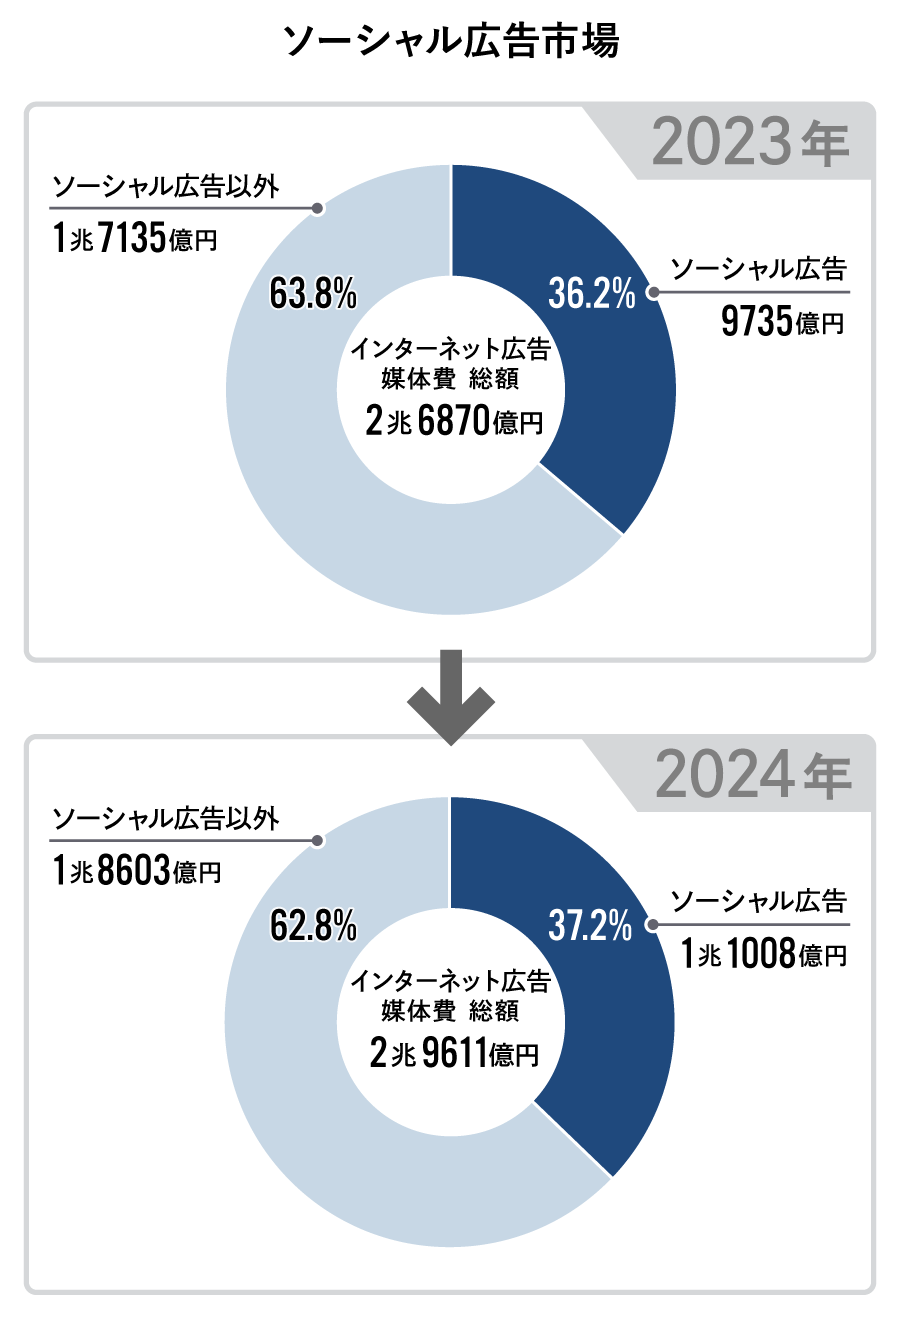
In 2024 internet advertising media spending, "social advertising" deployed on SNS platforms exceeded ¥1 trillion for the first time since estimates began, reaching ¥1.1008 trillion. This represents a high growth rate of 113.1% year-on-year, with its share of total internet advertising media spending expanding to 37.2%.
A closer look at the growth of the overall social advertising market reveals that video formats are becoming increasingly prominent within this space.
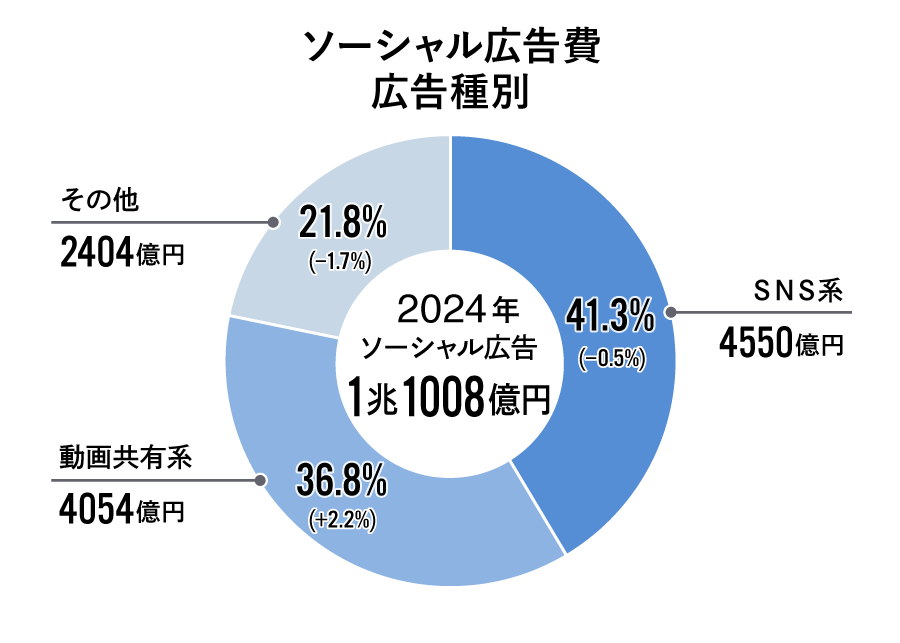
First, "SNS-based" advertising, which runs on SNS platforms, accounted for 455 billion yen, representing 41.3% of the total. However, this ratio has changed slightly from last year, decreasing by 0.5 percentage points.
On the other hand, advertising spending on "video sharing" ads, which run on user-generated video sharing sites, reached ¥405.4 billion, accounting for 36.8% of the total. This represents a notable growth of 2.2 percentage points compared to the previous year.
The "Other" category includes advertising on blogs and electronic bulletin boards. This segment decreased by 1.7 percentage points from the previous year, totaling ¥240.4 billion (21.8% share).
While the social advertising market is growing, the growth rates vary. Going forward, it will be important to watch how the balance between SNS-based advertising and video-sharing advertising evolves.
Topic 3: The Spread and Penetration of "Connected TV" Supporting the Expansion of the TV Media Digital Market
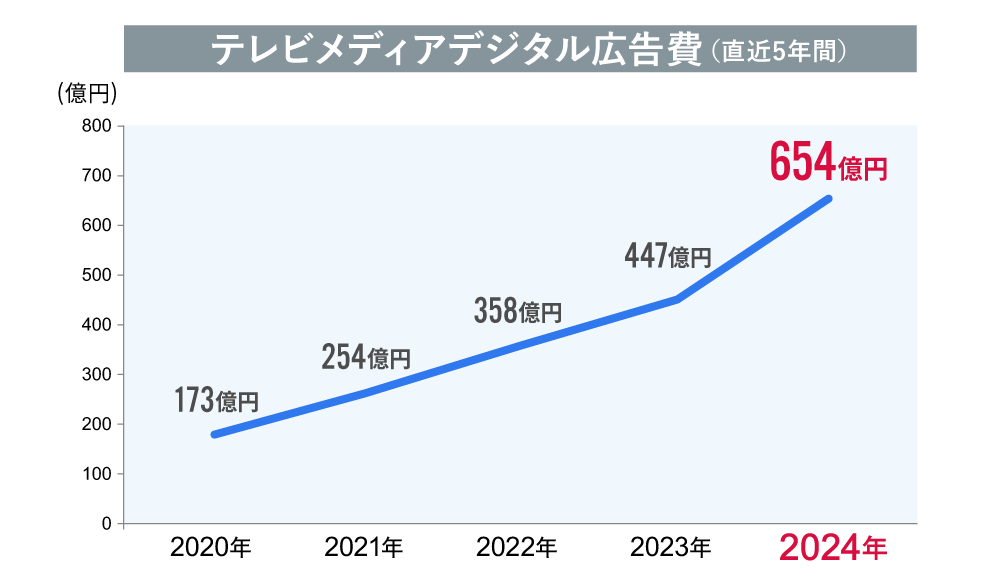
The "2024 Japan Advertising Expenditure" report highlighted that "TV Media Digital" – encompassing free on-demand video services and internet TV services provided by TV broadcasters – saw a remarkably large increase, growing 146.3% year-on-year to ¥65.4 billion.
This growth has been remarkable over the past five years, and with the overall video shift on the internet acting as a tailwind, this category is expected to continue growing.
The expansion of TV Media Digital advertising spending is underpinned by the penetration and establishment of "Connected TV (internet-connected TV devices)."
Households increasingly use TV devices to watch internet videos, driving corresponding growth in advertising placements on internet video-sharing sites. Demand for connected TVs—which offer larger displays than smartphones and are well-suited for shared viewing of movies, dramas, sports, etc.—is expected to continue rising.
According to certain published data, when comparing average daily viewing time on TV devices, commercial broadcasters rank first, followed by video sharing services in second place. Subsequent rankings also show subscription-based video streaming services and internet TV services ( ) closing in on commercial broadcasters.
"Advertising spending on e-commerce platforms for physical goods" has settled into a slightly more moderate growth trajectory.
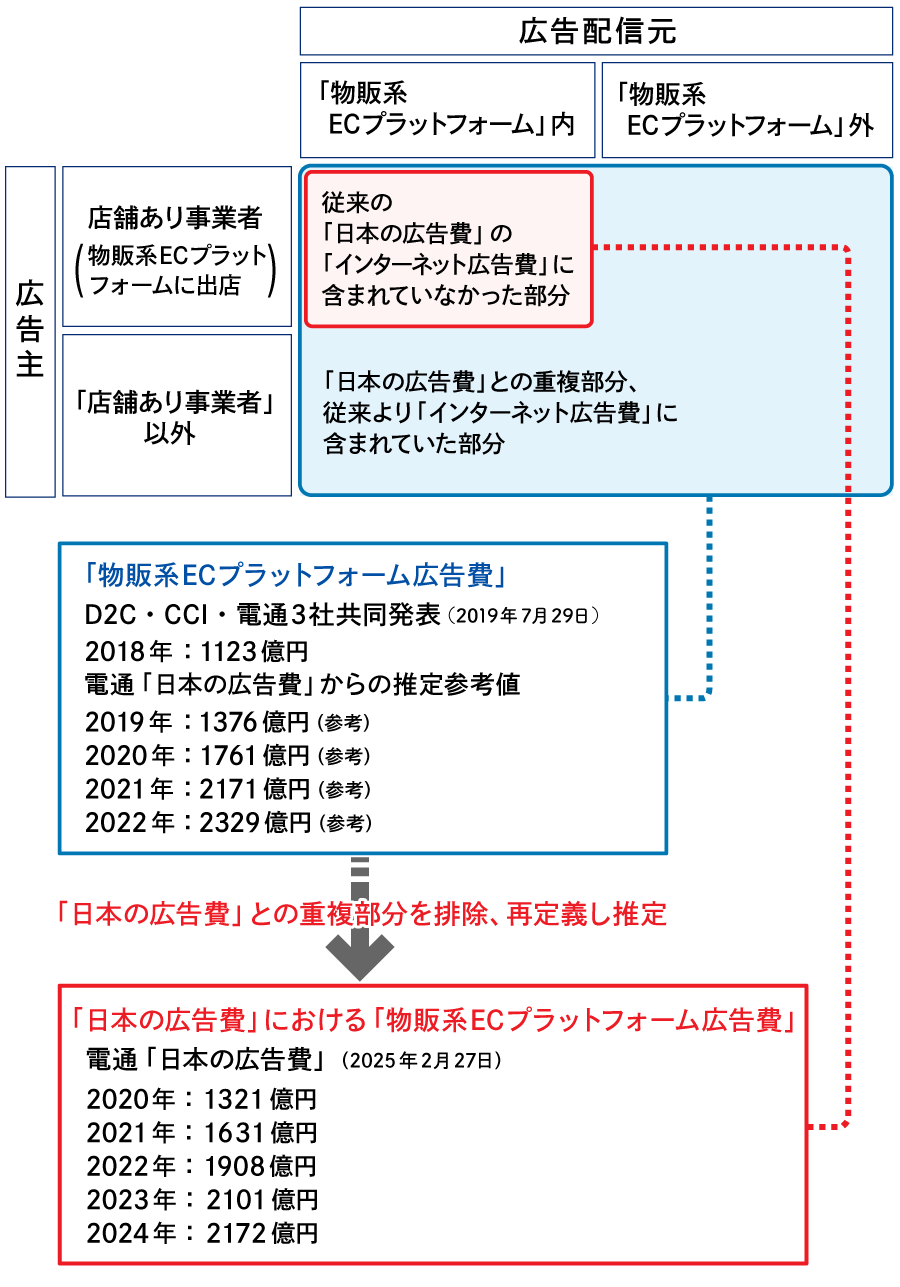
While this explanatory article primarily discusses internet advertising media costs, we will also touch on "product-based e-commerce platform advertising."
This refers to advertising used by retailers operating online stores on "mall-type" product-based e-commerce platforms to direct users to their product sales pages. Examples include ads that display their products as "PR items" at the top of keyword search results or feature their products on the top page during specific campaigns.
While advertising spending on product-based e-commerce platforms grew steadily in 2024 at 103.4% year-on-year, the growth pace shows signs of slowing slightly as the market expands. This may also reflect the e-commerce market itself stabilizing as the COVID-19 pandemic subsided.
Nevertheless, there remains room for expansion, and stable growth is expected going forward.
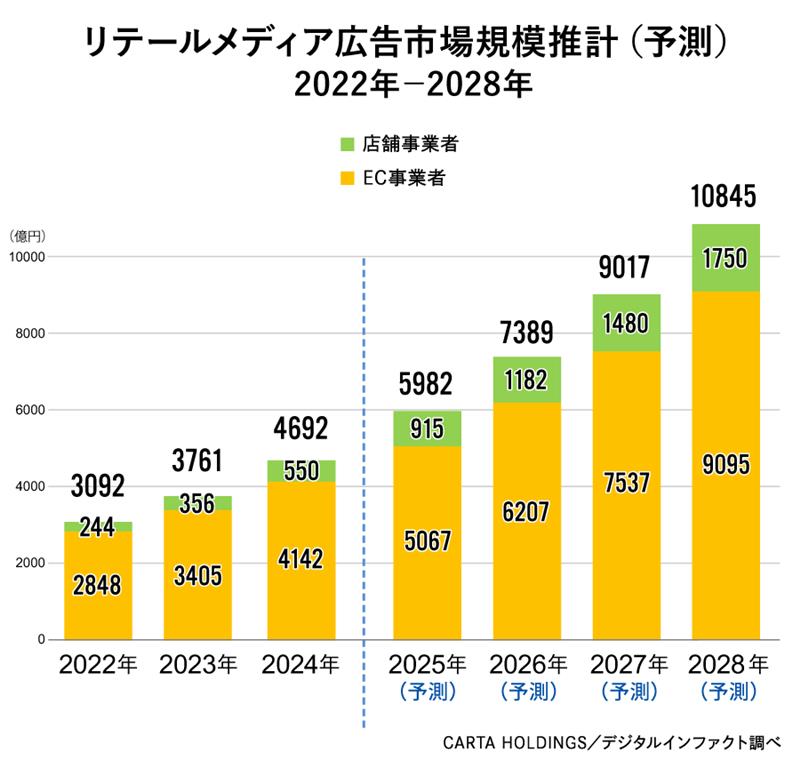
It should be noted that "advertising expenditure on product-based e-commerce platforms" can also be considered a type of media provided by distribution and retail businesses, commonly known as "retail media." While there is no universally agreed-upon definition for this term globally, the use of proprietary media—such as retail company apps and in-store digital signage—as advertising space is increasing, making it a currently prominent keyword.
What will happen to internet advertising spending in 2025? What impact will "ad-supported plans" for paid subscription video services have?
Internet advertising media spending in 2025 is projected to reach ¥3.2472 trillion, a 109.7% increase year-on-year. This will mark the first time internet advertising media spending surpasses ¥3 trillion.
Furthermore, when considering "internet advertising spending"—which includes internet advertising production costs and advertising spending on e-commerce platforms selling physical goods—it could potentially reach 50% of Japan's total advertising spending.
We believe continued growth in video advertising and social advertising will continue to drive the market. Video advertising, in particular, is expected to maintain double-digit growth, reaching 967.7 billion yen, a 114.7% increase year-on-year. Depending on the situation, video advertising alone could potentially exceed 1 trillion yen.
Regarding video advertising, growth in both in-stream and out-stream ads is forecast to be nearly equal. In-stream ads, in particular, are expected to see a significant increase in "ad-supported plans" offered by paid subscription-based video streaming services, which is anticipated to have a major impact on the industry.
Furthermore, the entry of these paid subscription-based video streaming services into the advertising market is expected to further expand advertising delivery on Connected TV, particularly programmatic advertising. Growth potential in this area remains substantial, drawing attention to future market trends.
Looking at ad formats, the trend of video ads increasing their share while display ads decrease is expected to continue in 2025. Furthermore, search-linked ads may see their growth rate affected by the utilization of generative AI tools and the diversification of search behavior within the e-commerce sector.
While the internet advertising market continues to grow substantially each year, challenges such as ad fraud and ad placements on inappropriate media persist. Against this backdrop, the importance of ensuring ads do not damage brand reputation—so-called "brand safety"—is increasingly paramount. Relevant agencies, including the Ministry of Internal Affairs and Communications, are also strengthening efforts to promote proper advertising practices through expert meetings and other initiatives.
As part of these efforts, ad verification tools (tools that monitor and evaluate ad placements and content quality to prevent inappropriate ad delivery) are gaining attention. While these tools have primarily been used for brand safety, they are now beginning to offer services that help advertisers improve ad effectiveness while ensuring ad quality.
Discussions regarding ad viewability (a metric indicating how much an ad is actually seen by users) are also progressing. Beyond traditional metrics like impressions, CTR (click-through rate), reach, and frequency, an environment enabling deeper analysis is being introduced. This includes "attention metrics" that measure detailed user engagement using technologies like eye-tracking.
It is said that over 90% of advertisers overseas already utilize attention metrics in some form, and the adoption of these new evaluation standards is also anticipated in Japan.
From a brand safety perspective, the continued adoption of PMPs (Private Marketplaces—closed advertising marketplaces where specific advertisers and publishers conduct limited transactions) remains necessary, as highlighted as a challenge last year.
PMP represents a form of programmatic advertising deployed within more trusted media, characterized by its reduced potential to damage brand value. Overseas, advertising budgets are often allocated more heavily to PMP than to open ad networks.
However, in Japan, there is a strong tendency to prioritize advertising effectiveness and cost efficiency. Consequently, advertising methods promising broader reach are often preferred over frameworks like PMP. Continued efforts to further develop the framework involving advertisers, publishers, intermediaries, as well as government and industry associations, remain crucial.
Finally, let's briefly touch on the current state of generative AI utilization, primarily in programmatic advertising. Major platforms are beginning to standardize AI-powered ad optimization tools within their advertising management dashboards.
These AI-powered tools are expected to reduce operational burdens and enhance advertising effectiveness when used for creative generation and ad delivery optimization. However, we also recognize that there are aspects requiring careful handling regarding AI adoption, such as transparency and control issues in AI-driven ad delivery.
While the internet advertising market is expected to continue growing, appropriately resolving these various challenges and building a trustworthy environment is crucial—not only for users, but also for us in the advertising industry and for advertising clients. We must continue to closely monitor market changes and explore ways to achieve sound and sustainable advertising operations.

Was this article helpful?
Share this article
Newsletter registration is here
We select and publish important news every day
For inquiries about this article
Back Numbers
Author

Takahiro Konno
CARTA COMMUNICATIONS, Inc.
Corporate Strategy Office
Joined Cyber Communications (now CARTA COMMUNICATIONS). After handling Dentsu Inc. and the Dentsu Group, worked as an Internet advertising media specialist, engaging with numerous media companies and platforms. Subsequently handled general agencies and specialized agencies, served on secondment to LIVE BOARD, and has been engaged in overall corporate planning since 2022.